What Is a Golden Cross?
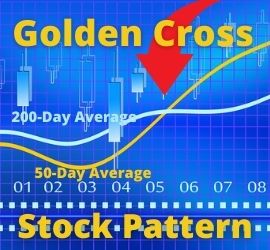 A Golden Cross is a bullish signal in a chart pattern. It happens when the short-term 50-day moving average uptrends across the long-term 200-day moving average.
The golden cross is a technical stock charting pattern interpreted as a bullish signal by many analysts and traders. It occurs when a relatively short-term moving average crosses above a long-term moving average. The golden cross is a bullish breakout pattern formed from a crossover involving a security’s short-term and long-term moving averages.
For example, when the 50-day short-term moving average breaks above the long-term 200-day moving average or resistance level. The crossover potentially indicates a bull market on the horizon and is reinforced by higher trading volumes.
The Golden Cross – A Closer Look
There are three stages to a golden cross. The first stage is a downtrend that eventually bottoms out as selling loses momentum. In the second stage, the shorter moving average forms a crossover up through the longer moving average. The uptrend signals a breakout and confirmation of trend reversal. The last stage is a continuing uptrend highlighted by greater volume and higher prices. The moving averages act as support levels on pullbacks. This continues until another crossover occurs as a downtrend in the opposite direction. At which point, a death cross may form. The death cross is the opposite of the golden cross. It occurs when the shorter moving average forms a crossover down through the longer moving average. The most commonly used moving averages are the short-term 50-day and the long-term 200-day moving averages. In general, longer time periods tend to form stronger lasting breakouts.
For example, the daily 50-day moving average crossover up through the 200-day moving average on an index like the S&P 500 is one of the most popular bullish market signals. With a bellwether index, the motto “A rising tide lifts all boats” applies when a golden cross forms as the buying resonates throughout the index components and sectors. (Source: investopedia.com)
The Three Stages of a Golden Cross
- Downtrend – The first phase is where a downtrend exists but selling interest is being overpowered by stronger buying interest.
- Crossover on an uptrend – The second phase involves the emergence of a new uptrend. The shorter moving average forms a crossover up through the larger moving average. This signals a breakout and confirmation of the trend reversal. The breakout of the new uptrend is confirmed when the short-term average crosses from below to above the long-term average, forming the Golden Cross.
- Continuing gains – In the final phase, the new uptrend is prolonged. The continuing gains confirm a bull market. During this phase, the Golden Cross’ two moving averages should both act as support levels when corrective downside retracements occur. As long as both price and the 50-day average remain above the 200-day average, the bull market is considered as remaining intact.
Day traders commonly use shorter time periods. For example, the 1-day and 1-hour moving averages to trade intra-day crossover breakouts. The time interval of the charts can be adjusted from minutes to hours, to days, weeks, or months. Longer periods tend to make for stronger signals. The same applies to chart time periods as well. The longer the chart time frame, the stronger the golden cross breakout tends to be. (Source: ibid)
How to Use the Golden Cross
Traders can utilize the Golden Cross to help determine good times to both enter and exit the market. The indicator can also help them better understand when it makes sense to sell and when it’s better for them to buy and hold. Traders looking to go long will sometimes enter the market when the security’s price rises above the 200-day moving average. They do this rather than waiting for the 50-day moving average to make the crossover. This is because the Golden Cross tends to be a lagging indicator. As a result, the cross may not occur until after the market has already turned from bearish to bullish.
Traders who short the market may use the same crossover signal as an indicator that the bear market is over. It’s time to exit their short positions and consider going long. The Golden Cross is applied to trading both individual securities and market indexes such as the S&P 500. Some traders use different moving averages to indicate a Golden Cross. For example, a trader might substitute the 100-day moving average in place of the 200-day. The pattern can also be utilized on shorter time frames, such as an hourly chart.
Many analysts use complementary technical indicators to confirm the indication from a Golden Cross. Momentum indicators such as the Average Directional Index (ADX) or the Relative Strength Index (RSI) are popular choices. This is because momentum indicators are often leading, rather than lagging, indicators. As a result, this can help in overcoming the Cross pattern’s tendency to lag behind price action.
Example
As a hypothetical example, a monthly 50-period and 200-period moving average golden cross are significantly stronger and longer-lasting than the same 50, 200-period moving average crossover on a 15-minute chart. Golden cross breakout signals can be utilized with various momentum oscillators like stochastic, moving average convergence divergence (MACD), and relative strength index (RSI) to track when the uptrend is overbought and oversold. This helps to spot ideal entries and exits. (Source: ibid)
The Golden Cross vs the Death Cross
A golden cross and a death cross are exact opposites. A golden cross can signal the beginning of a bull market, while a death cross can signal the beginning of a bear market. Both crosses refer to the crossover of a long-term moving average by either a short-term uptrend or a short-term downtrend.
- The golden cross occurs when a short-term moving average crosses over a major long-term moving average to the upside. It is interpreted by analysts and traders as a potential long-term upward turn in a market.
- The death cross is a similar downside moving average crossover point. It is interpreted to signal a decisive downturn in a market.
Either crossover is considered more significant when accompanied by high trading volume. Once the crossover occurs, the long-term moving average acts as a major support level in the case of the golden cross. It acts as a resistance level in the case of the death cross from that point forward. Either cross may occur as a signal of a trend change. However, they more frequently occur as a confirmation of a change in trend that has already taken place.
Golden Cross Limitations
In general, most indicators are lagging and no indicator can truly predict the future. The golden cross is no exception. Often enough, an observed golden cross produces a false signal. A trader blindly acting on that signal and going long at that time could find he acted too quickly. There is a positive correlation in forecasting strong bull market trends. Nevertheless, a golden cross does not always deliver on that correlation. Therefore, the signal should always be confirmed with other indicators before engaging in a trade. The key to using any signal is to confirm with additional filters and indicators and always use proper risk parameters. Keeping to a favorable risk-to-reward ratio and confirming with other indicators can lead to better results than just following the cross blindly.
- Lagging indicator – Some traders and market analysts remain resistant to using the Golden Cross or the Death Cross as reliable trading signals. Their objections principally stem from the fact that the Cross pattern is frequently a very lagging indicator.
- Self-fulfilling – It is a technical indicator used by many traders and analysts. The chart pattern is, therefore, likely to attract a significant amount of buying in a market. If it does, then it may become a sort of self-fulfilling prophecy. Traders see the pattern and buy the market, and their buying is sufficient to create or sustain a bullish trend.
Day Trading Tip
Does the Golden Cross work for day traders using 1-hour or 15-minute charts?
Yes, the concepts of using the golden cross signal as a trend filter or to trail your stop loss can work on shorter timeframes. However, caution must always be used. This is a lagging indicator, so timing your entry or exit puts you one step behind without other confirming information.
Up Next: What is Standard Error of the Mean?
 The standard error of the mean measures how closely a set of sample data represents an actual population using standard deviation.
SEM is calculated by taking the standard deviation and dividing it by the square root of the sample size. The standard error gives the accuracy of a sample mean by measuring the sample-to-sample variability. The SEM describes how precise the mean of the sample is as an estimate of the true mean of the population. As the size of the sample data grows larger, the SEM decreases versus the standard deviation. In other words, as the sample size increases, the sample mean estimates the true mean of the population with greater precision. In contrast, increasing the sample size does not make the standard deviation necessarily larger or smaller. However, it becomes a more accurate estimate of the population standard deviation.