What Is a T Distribution?
 The T distribution is a statistical distribution curve that looks almost identical to the normal statistical distribution curve. However, it is used instead when evaluating smaller samples. As a result, the T distribution tends to be shorter with fatter tails.
The T distribution is frequently referred to as the Student’s T Distribution. It refers to a group of distributions that are slightly shorter and fatter than the usual distribution curve. Because T distributions have a higher likelihood of including extreme values than normal distributions, they have thicker tails. The t distribution resembles the normal distribution more as the sample size increases. In fact, with sample sizes greater than 20, the distribution closely resembles the normal distribution.
T-score Vs. Z-score
When using larger sample sizes, for example, over 30, the t-distribution and z-distribution look pretty much the same. Therefore, you can use either distribution.
- T-score – T-scores, and z-scores, are a conversion of individual scores into a standard form. However, t-scores are employed when the population standard deviation is unknown.
- Z-score – Technically, z-scores are standardization of individual scores. The conversion helps to compare different data sets more readily. It is based on the knowledge of the population’s standard deviation and the mean. A z-score indicates how far the result deviates from the mean. You can utilize an understanding of normal distributions such as the 68, 95, and 99.7 rules. Alternatively, you can use the z-table to calculate what percentage of the population will fall below or above your result.
What is a Sample Size?
The sample size is a subset of a population selected for a survey or investigation. For instance, you may conduct a study of cat owners’ breed preferences. Realistically, you won’t want to survey all of the country’s millions of cat owners. It is just not practical because it would be either too expensive or time-consuming. Instead, researchers look at smaller sample sizes. Maybe they would choose hundreds or thousands of owners instead of millions. The sample size should fairly represent all cat owners’ breed preferences. It can provide a very accurate result if you chose your sample appropriately.
When you just poll a small portion of the population, you introduce uncertainty into your statistics. You can never be guaranteed that your statistics are a complete and accurate depiction of the population. This is the challenge when you can only poll a certain percentage of the genuine population. This uncertainty is known as sampling error, and it is typically expressed as a confidence interval. For example, you may say that your results have a 90% confidence level. That suggests that if you repeated your survey 90 percent of the time, you would get the same results.
T Distribution – A Closer Look
The T Distribution and the accompanying t scores are used in hypothesis testing. They help to determine whether the null hypothesis should be accepted or rejected.
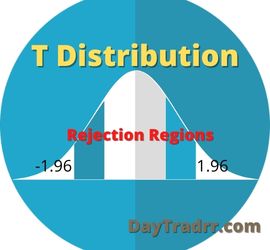
The core section of the graph represents the acceptance area, while the tail represents the rejection region or regions. The rejection region is colored white in this graph of a two-tailed test. Z-scores or t-scores can be used to characterize the area in the tail. For example, the figure to the left depicts a 5% area in the tails comprised of 2.5 percent on each side. The z-score would be 1.96, representing 1.96 standard deviations from the mean. If z is less than -1.96 or greater than 1.96, the null hypothesis is rejected.
In general, this distribution is employed when the sample size is small or the population standard deviation is unknown. In practice, this is almost always the case. So, unlike in elementary statistics class, you’ll probably use it more than the normal distribution in real-world scenarios. If your sample size is large enough, the two distributions are nearly identical.
What Does a T Distribution Tell You?
A T distribution parameter determines tail heaviness. It is called degrees of freedom. The number of independent pieces of information used to calculate an estimate is referred to as its degrees of freedom. It isn’t exactly the same as the number of items in the sample. To calculate the degrees of freedom for the estimate, subtract 1 from the number of elements. The smaller values result in heavier tails. The larger values cause the T distribution to resemble a typical normal distribution with a mean of 0 and a standard deviation of 1.
A t-test determines whether your test statistic is more extreme than expected from the t-distribution. A two-tailed test examines both tails of the distribution. In a two-tailed test, the null hypothesis is rejected if the test statistic is greater than the absolute value of the reference value. If the test statistic result is in either the lower or upper tail, the null hypothesis is rejected. If the test statistic falls between the two reference lines, the null hypothesis is not rejected.
Using T-tables
Most people use software to perform the calculations needed for t-tests. But many statistics books still show t-tables, so understanding how to use a table might be helpful.
- One-tailed or two-tailed testing – Determine whether the table is for two-tailed or one-tailed testing. Then, select whether your test is one-tailed or two-tailed. T-columns tables represent distinct alpha levels.
- Degrees of freedom – Determine your data’s degrees of freedom. The rows in a t-table represent distinct degrees of freedom. Most tables progress up to 30 degrees of freedom before stopping. For sample sizes larger the 30, the tables presume people will simply employ a z-distribution.
- T distribution value – Find the cell in the table that corresponds to your alpha level and degrees of freedom. This is the value of the t-distribution. Double-check your conclusion by comparing your statistic to the t-distribution value.
- Err on the side of caution – Sometimes, the corresponding degree of freedom is not supplied in the table. In that case, use the value for the nearest degree of freedom smaller than the given value. This technique is used to err on the side of caution. It prevents obtaining a t-value that is slightly greater than the precise t-value and overstating the result.
The Difference Between a T Distribution and a Normal Distribution
When the population distribution is considered to be normal, normal distributions are utilized. The T distribution is quite similar to the normal distribution, except that the tails are fatter. Both assume that the population is normally distributed. The sharpness of the peak of a frequency-distribution curve is greater in T distributions than in normal distributions. A T distribution has a higher possibility of obtaining values that are quite distant from the mean than a normal distribution.
Limitations of Using a T Distribution
When compared to the normal distribution, the T distribution can skew slightly from normal. However, this flaw only manifests itself when complete normalcy is required. When the population standard deviation is unknown, the T-distribution should be utilized. The normal distribution should be employed for better results if the population standard deviation is known and the sample size is large enough.
Up Next: How to Stop Child Support from Taking Tax Refund 2022-2023
 How to Stop Child Support from Taking Tax Refund: The best way is to stay current, but there are things you can do to minimize a tax seizure. If you fall behind on child support payments, the government will make every effort to collect them. This includes garnishing your salary as well as confiscating your tax refunds. However, there are steps you can take if you are delinquent. For example, you can contact your local Department of Child Support and Enforcement (DCSE) office to file an appeal, Or, you can set up a payment plan for your outstanding payments, and request a hearing. These options can at least delay the state and federal governments from seizing your tax refunds.
The Treasury Department’s Financial Management Service division will notify you of an anticipated tax refund seizure before it occurs. You can take advantage of this opportunity to decide on a course of action. Acting quickly, you may be able to reduce the impact of the seizure on your finances. Of course, paying child support on time is the best method to prevent an IRS Tax Refund Seizure. Maybe, you have lost your job or have pressing circumstances that impact your ability to make payments on time. For assistance, contact your local child support agency and explain the situation. Or, return to court to see if you may reduce child support based on your current income. Do not simply ignore your child support duty. Failing to make timely payments can result in contempt of court actions, fines, and other punitive measures. For instance, Child Support taking your tax refund.