What Is a Discrete Probability Distribution?
 A discrete probability distribution describes the occurrence of a discrete random variable with a countable value and a non-zero probability. A discrete probability distribution displays the occurrence of discrete, individually countable events like 1, 2, 3,… or zero vs. one. For instance, the binomial distribution is a discrete distribution. It evaluates the likelihood of a yes or no outcome occurring over a specific number of trials. For example, flipping a coin 100 times and getting heads, given the event’s probability in each trial.
Statistical distributions can be discrete or continuous. A continuous distribution is made up of outcomes that fall on a continuum. For example, all values greater than 0 which includes decimals that continue indefinitely. Overall, discrete and continuous probability distributions, as well as the random variables they describe, are the foundations of probability theory and statistical analysis.
Discrete Probability Distribution – A Closer Look
Distribution is a statistical term that is utilized in data analysis. Those attempting to determine the outcomes and probabilities of a certain study will chart measurable data points. In turn, the charted data set produces a probability distribution map. A distribution analysis can provide a variety of probability distribution diagram shapes. For example, the normal distribution or bell curve. The nature of the outcomes can help statisticians detect the formation of either a discrete or continuous distribution. Distributions must be either discrete or continuous. A discrete distribution is built from data that can only follow a finite or discrete set of outcomes. Conversely, the normal distribution is continuous and accounts for all potential outcomes along the number line.
Thus, discrete distributions represent data with a countable number of outcomes. This implies that the alternative outcomes can be listed. However, the list could be either finite or unlimited.
- A discrete distribution – When investigating the probability distribution of a die with six numbered sides, for example, the list is 1, 2, 3, 4, 5, 6.
- A binomial distribution – has only two possible outcomes: zero or one. For example, flipping a coin yields the list Heads, Tails.
- The Poisson distribution – is a discrete distribution that counts the frequency of occurrences as integers in a list that can be infinitely long (0, 1, 2,…)
Discrete Probability Distribution Examples
Consider the following scenario. You want to track the number of individuals who lodge a complaint at the customer service counter during any particular hour. The values must be countable, finite, and non-negative integers. It is not feasible to enter into a store with 0.5 people. Nor is it possible to walk into a store with a negative number of people. As a result, the value distribution would be discrete when displayed on a distribution plot. Binomial, Poisson, Bernoulli, and multinomial are the most frequent discrete probability distributions.
Finance
The Poisson distribution is frequently used to describe financial count data where the total is modest and frequently zero. In finance, for example, it can be used to model the number of transactions that a typical trader will make on a given day. For instance, it can be 0 (often), 1, or 2, and so on. Also, this model can be used to forecast the probability of an event. For example, the number of market declines that occur over a specific time period. Say, over a year or a decade.
Business management
Inventory management is another area where such a distinct distribution can be beneficial to firms. Examining the frequency of inventory sold in conjunction with a finite amount of inventory available. This can offer a probability distribution that leads to optimal inventory allocation to effectively utilize limited square footage.
Options pricing models
Binomial distributions are employed in option pricing models that utilize binomial trees. The underlying asset in a binomial tree model can only be worth one of two possible values. With the model, there are only two possible outcomes with each iteration. This results in a move up or a move down with defined probability.
Monte Carlo simulations
The Monte Carlo simulation is a modeling technique that shows discrete distributions. It uses programmed technology to determine the odds of various scenarios. It is mostly used to aid in scenario forecasting and risk identification. Outcomes with discrete values will generate discrete distributions for study in Monte Carlo simulation. These distributions are used to assess risk and trade-offs among various items under consideration.
Discrete Probability Distribution FAQs
What Are the Types of Discrete Probability Distribution?
The binomial, Poisson, Bernoulli, and multinomial distributions are the most commonly utilized discrete distributions by statisticians and analysts. Other distributions include the negative binomial, geometric, and hypergeometric.
What Are the Requirements for a Discrete Probability Distribution?
Random variable probabilities must have discrete rather than continuous values as outcomes. The probability of each discrete observation in a cumulative distribution must be between 0 and 1. Also, the sum of the probabilities must equal one (100 percent ). If there is just a limited set of possible outcomes the data is discrete. For example, only zero or one, or only integers.
What Is a Continuous Distribution?
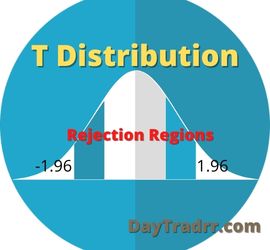
A continuous probability distribution, unlike a discrete distribution, can contain outcomes of any value. This includes indeterminant fractions. For example, a normal distribution is represented by a bell-shaped curve. It is an uninterrupted line spanning all values across its probability function. In other words, a probability distribution with the random variable X having any value is continuous. As a result, X can take on an unlimited number of values. Therefore, the probability of X taking on any one specific value is zero.
What’s the difference between discrete probability distributions and continuous probability distributions?
There are two types of probability distributions: discrete and continuous. A discrete distribution implies that X can take on one of a countable (typically finite) number of possible values. Whereas a continuous distribution implies that X can take on an infinite (uncountable) number of different values.
Up Next: PEG Ratio – What Is the Price/Earnings-to-Growth?
 The PEG ratio is a metric that assists in determining the value of a stock by comparing market price, earnings, and future growth potential. The PEG ratio is the price/earnings to growth ratio. It is a stock’s price-to-earnings (P/E) ratio divided by the earnings growth rate over a given time period. The PEG ratio is used to estimate the value of the stock while also considering the company’s predicted profit growth. It is regarded to provide a more complete picture than the more common P/E ratio.
Many investors examine a company’s price-to-earnings ratio (P/E ratio) to decide if it is a suitable investment. However, P/E alone may conceal that the stock is overpriced or underpriced without considering future earnings growth. The price-to-earnings ratio of a corporation is simply the stock price divided by earnings per share. For example, consider two companies that have the same price-to-earnings ratio. But, one has experienced a 40% increase in earnings over the last three years. The other has only experienced a 10% increase in earnings. Therefore, the stock that is growing faster is likely underpriced and may be a better company to invest in.