What Is a Sine Wave?
 A sine wave is a geometric curve with a smooth, continuous, periodic oscillation. For traders, it indicates if a market is trending or in a cyclic mode.
Sine waves are used in technical analysis and stock trading to help identify patterns. As an analytical trading tool, they indicate if a market is trending or in a cycle mode. It helps traders identify the start and finish of a trending move as well as possible shifts and crossovers in the trend.
A sine wave oscillates. This means it moves up, down, or side-to-side in a repetitive pattern. Mathematically, it is defined by the function y = sin x. When graphed, it is an s-shaped, smooth wave that oscillates above and below zero. Sine waves are used in technical analysis and financial trading to help identify patterns and cross-overs related to oscillating price and market trends.
The Sine Wave – A Closer Look
Amplitude
 The amplitude of a sine wave is the maximum distance it reaches from zero. Since the sine function varies from +1 to -1, the amplitude is one. It is the distance from the centerline or the mean position to the top of a crest or to the bottom of a trough.
For electrical voltage measurements, the amplitude often refers to the peak-to-peak voltage (Vpp). This number will be twice the mathematical amplitude. Sound also travels in waves. If this is a sound wave, the higher the amplitude, the louder the sound volume.
Frequency
The frequency of a sine wave is the number of complete cycles that happen every second. A cycle and a period refer to the same thing. The frequency is measured in cycles per second. For this, there is a standard unit of frequency called the Hertz, abbreviated Hz. One Hertz (1Hz) is equal to one cycle per second. The sound wave that corresponds to Middle C on the piano is approximately 256Hz. If you tune your FM radio to 88.4, the radio wave carrying that station or channel has a frequency of 88.4MHz. This means 88.4 megaHertz, or 88.4 million cycles per second.
Period
 The period of a wave is the time it takes to complete one full cycle. The wave is just a series of identical cycles that happens repeatedly. In the USA, the electrical current in a house has a period of one-sixtieth of a second.
This is because the U.S. electrical standard has a frequency of 60Hz or 60 cycles per second. Small times intervals like this are usually measured in milliseconds (mS) which are one-thousandth of a second. One-sixtieth of a second is approximately 17 milliseconds. (Source: mathopenref.com)
Sine Wave Market Indicators
Some investors firmly believe that the financial markets move in cyclical patterns. The sine wave indicator is based on the assumption that markets follow these cyclical patterns. Once a cycle is identified, a trader may try to use the pattern to develop a leading indicator. This works extremely well when, in fact, the market moves in a cycle. However, when the market is trending, this system breaks down and investors need to adjust for that in their trades.
Markets typically alternate between periods of cycling and trending. Cyclical periods are characterized by prices bouncing off support or resistance levels and failed breakouts or overshoots. Trending periods are characterized by new highs or new lows and pullbacks. Momentum continues in the direction of the trend until it runs out of steam and reverses.
In technical analysis, oscillators are often used that may have sine-shaped characteristics. An oscillator exists between two extreme values and then builds a trend indicator with the results. The analysts then use the trend indicator to discover short-term overbought or oversold conditions. When the value of the oscillator approaches the upper extreme value, analysts interpret that information to mean that the asset is overbought, and as it approaches the lower extreme, analysts consider the asset to be oversold. (Source: investopedia.com)
Patterns and Cycles in Financial Markets
Stock and commodity market prices often move in a regular and repetitive manner. They can look like a series of ocean waves on the chart. Each wave in a series of waves has a specific height and length. This pattern is called a cycle when those waves are the same or nearly the same from wave to wave. Or, when the waves are consistently proportional to one another. Some market price cycles follow economic developments. Some patterns that look like cycles follow some other principle. For example, some traders look for patterns in the lunar cycle or sunspot cycles. In some cases, analysts can find a strong correlation with numbers series or a connection to some other cause that is unseen and unproven.
When applied to financial markets, the belief is that human behavior forms and repeats in specific recurring patterns. However, when financial markets form cycles it is impossible to know for certain whether the event is random or arises from some unexplained aspect of crowd behavior.
- Cycles – have a repetitive character. Not only will prices surge and retreat, but they’ll also surge and retreat in a more or less orderly manner so that you can count the periods between them and use that count to project the next surge and retreat.
- Waves – can be big or small, short-term or long-lasting, choppy or orderly. You don’t know when a wave begins how far it will go. Market waves aren’t like ocean tides.
Cycle theorists (and physicists) speak of their cycle components as waves. You can have waves without a cycle, but you can’t have a cycle without waves. (Source: dummies.com)
The Sine Wave Pattern in Chart Analysis
The sine wave as a technical chart analysis tool has a solid foundation in geometry and trigonometry. It is designed to indicate whether a market is trending or in a cycle mode. In turn, this can help traders identify the start and finish of a trending move as well as possible shifts in the trend. The leading indicator is called the MESA indicator. It was developed by John Ehlers based on an algorithm that was originally applied to digital signal processing. The MESA Phase predicts market short-term and mid-term movements. It consists of two lines, called the Sine Wave and the Lead Wave. When the price is trending, the lines do not cross and usually run parallel and distant from each other. Analysts look for clear divergence signals or to detect price reversal indications.
The Composite Index of Lagging Indicators resembles a sine wave. This is because the measures that make up the index (i.e. ratios and interest rates) tend to oscillate between a range of values. For example, inflation is always kept between specified rates. Once inflation meets or exceeds a specified limit, interest rates will be adjusted to either increase or decrease inflation. As a result, inflation is brought within a target range. Thus, as the rate of inflation increases, decreases, or stays the same, interest rates will oscillate up and down to control an undesired rate of inflation. (Source: investopedia.com)
Sine Wave Crossover Interpretation
Crossovers between Sine Waves and Leading Waves can signal turning points and generate buy or sell signals. Of course, under the right conditions. The indicator can also signal if a market is overbought or oversold. This means the price is unjustifiably high or unjustifiably low and could point to a stalling or reversal of the trend. Sine Wave Analysis can be used alone or in combination with other techniques. For example, non-correlated indicators such as moving average-based indicators. In any event, the Sine Wave is a useful tool providing technical insight for an analyst.
Line crossovers could also indicate turning points and generate buy or sell signals under the right conditions. The indicator can also signal an overbought or oversold market (i.e., unjustifiably high or unjustifiably low), which can have implications on the prevailing trend. Whether used alone or in combination with other techniques or non-correlated indicators (such as moving average-based indicators), the sine waves are very useful for a trader. (Source: ibid)
Elliott Wave Theory
Ralph Nelson Elliott was a professional accountant. He developed the hypothesis in the 1930s to provide insight into the potential future course of major price changes in the stock market. In time, his idea has become broadly accepted by the investor community. The Eliott Wave Theory can be used together with additional technical research to qualify new opportunities. The principle works to assess the course of consumer values by the study of impulse waves and corrective wave patterns. Impulse waves comprise a total of five distinct smaller degree waves traveling in the form of a greater pattern. The corrective waves are three distinct smaller degree waves moving in the opposite direction.
Elliott became convinced that wave retracements frequently agree with Fibonacci ratios. For example, 38.2% and 61.8%, based on the golden ratio of 1.618. Wave patterns are components of the Elliott Wave oscillator. An Elliott Wave-inspired instrument tracks price trends as either positive or negative. And, above or below a set horizontal axis. The Elliott Wave Theory remains a popular trading technique. Others have built upon the Elliott Wave Model. For example, Robert Prechter founded a company called Elliott Wave International. Its focus is market analysis and builds on Elliott’s original work by combining it with new technology such as artificial intelligence.
Impulse Wave Patterns
An impulse wave pattern refers to a technical trading concept. It refers to a vigorous price movement that interferes with the primary path of the usual trend. It is used in the Elliott Wave Theory to evaluate and predict long-term fluctuations in stock market prices. (Source: corporatefinanceinstitute.com)
Sine Wave Patterns and Financial Cycles – Final Thoughts
Indicators fail sometimes. And, sometimes even the best research can yield the wrong result. So, any extra help you can get from outside the box can possibly add to your trading edge. This can include looking at volume, market sentiment, fundamentals, seasonality, or cycles.
The opinion is divided about whether cycles are an integral part of technical analysis. Cycles fit into the technical universe because they appear embedded in price terms without reference to fundamentals. Some technical analysts fully embrace cycle theory. Some augment cycle theory with other indicators. Others dismiss the concept altogether as wishful thinking or requiring too much effort to not be useful. You don’t need to embrace a cycle theory to become a skilled technical analyst. Also, you can safely ignore cycle theories altogether if you choose. But, you should at least be aware of the existence of financial cycle theories. The more you know, the better able you are to evaluate their assertions and promotions.
Up Next: What Is a Golden Cross?
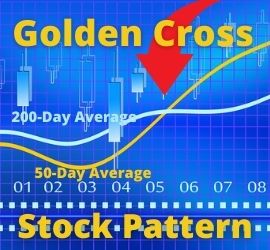 A Golden Cross is a bullish signal in a chart pattern. It happens when the short-term 50-day moving average uptrends across the long-term 200-day moving average.
The golden cross is a technical stock charting pattern interpreted as a bullish signal by many analysts and traders. It occurs when a relatively short-term moving average crosses above a long-term moving average. The golden cross is a bullish breakout pattern formed from a crossover involving a security’s short-term and long-term moving averages.
For example, when the 50-day short-term moving average breaks above the long-term 200-day moving average or resistance level. The crossover potentially indicates a bull market on the horizon and is reinforced by higher trading volumes.