What is the Plowback Ratio?
 The plowback ratio is the percentage of earnings a company reinvests rather than paying out higher dividends. for example, buying fixed assets. This ratio is an indicator of how much profit is retained in a business instead of being paid out to the investors. It generally represents the portion of retained earnings, which could have otherwise been distributed in the form of dividends.
The plowback ratio is a fundamental analysis tool. It measures how much earnings are retained after dividends are paid out. This ratio is often referred to as the retention rate. It is the opposite of the payout ratio. That metric measures how much dividends are paid out as a percentage of earnings.
The Plowback Ratio Formula
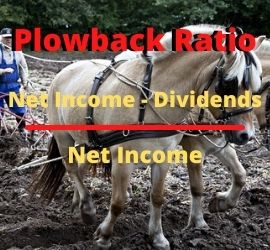
The plowback ratio is calculated by subtracting dividends from net income and then dividing the result by net income. It can also be calculated by subtracting dividends per share divided by earnings per share from 1. A third method is to determine the leftover funds after calculating the dividend payout ratio.
Plowback Ratio (Retention Rate) = Net Income – Dividends / Net Income
On a per-share basis, the retention ratio can be expressed as:
Plowback Ratio (Retention Rate) = 1 – (Dividend Per Share / Earnings Per Share)
Example
For example, consider a company that reports $10 of EPS and $3 per share of dividends. It will have a dividend payout ratio of 30% (0.30) and a plowback ratio of 70% (0.70).
What Does the Plowback Ratio Tell You?
The plowback ratio is an indicator of how much profit is retained in a business rather than paid out to investors. Younger businesses tend to have higher plowback ratios. These faster-growing companies are more focused on business development. More mature businesses are not as reliant on reinvesting profit to expand operations. The ratio is 100% for companies that do not pay dividends and is zero for companies that pay out their entire net income as dividends.
The plowback ratio is most useful when comparing companies within the same industry. Different markets require different utilization of profits. For example, it is not uncommon for technology companies to have a plowback ratio of 1 (that is, 100%). This indicates that no dividends are issued, and all profits are retained for business growth. The plowback ratio represents the portion of retained earnings that could potentially be dividends. Higher retention ratios indicate management’s belief in high growth periods and favorable business economic conditions. Lower plowback ratio computations indicate uncertainty in future business growth opportunities or satisfaction in current cash holdings. (Source: investopedia.com)
Investor Preference
The plowback ratio is a useful metric for determining what companies to invest in. Investors preferring cash distributions avoid companies with high plowback ratios. However, companies with higher plowback ratios could have a greater chance of capital gains. They achieve this through appreciated stock prices during the growth of the organization. Investors interpret stable plowback ratio calculations as indicators of current stable decision-making. This can help them spot management trends that can help shape future expectations. The ratio is typically higher for growth companies that are experiencing rapid increases in revenues and profits. A growth company would prefer to reinvest earnings back into its business. This allows them to reward their shareholders by increasing revenues and profits at a faster pace than shareholders could achieve by investing their dividends themselves.
Impact from Management
Management decisions directly impact the plowback ratio. This is because management determines the dollar amount of dividends to issue. Additionally, the calculation of the plowback ratio requires the use of earnings per share (EPS). Dividend payout ratios, and thus plowback ratios, are significantly influenced by a company’s choices of accounting methods. For example, different depreciation methods affect a company’s earnings per share. This, in turn, affects the dividend payout ratio. An unusually low plowback ratio over time can often predict a cut in dividends when the company encounters a need for cash. This metric is influenced by a company’s choice of accounting method. As a result, the plowback ratio itself is highly influenced by variables within the organization controlled directly by management.
Why Does a Plowback Ratio Matter?
Plowback ratios indicate how much profit is being reinvested in the company rather than paid out to investors. Some investors prefer the cash distributions associated with low plowback-ratio companies. Other investors prefer the capital gains they can anticipate from a company’s reinvestment of earnings. Older, more mature companies generally have a lower plowback ratio than fast-growing companies. Younger, growth-oriented companies are typically more focused on reinvesting cash in order to grow the business. Indirectly, the plowback ratio is another way to identify growth companies.
It is important to understand that capital needs and investor expectations vary from industry to industry. This is why comparison of plowback ratios is generally most meaningful among companies within the same industry. Also, the definition of a “high” or “low” ratio should be made within this context.
The size of the plowback ratio will attract different types of investors.
- Income-oriented investors – expect a lower plowback, as this suggests high dividend possibilities to the shareholders.
- Growth-oriented investors prefer a high plowback implying that the business has profitable internal use of its earnings. This, in turn, pushes up the stock prices resulting in capital appreciation.
When the plowback ratio is close to 0%, there is a distinct possibility the firm will be unable to maintain the current level of dividend distributions. When a firm distributes all returns back to the investors, eventually, there will not be sufficient cash available to support the capital requirements of the business.
Plowback Ratio Limitations
There are limitations to consider when using the plowback ratio. For example, earnings per share do not necessarily equate to cash flow per share. As a result, the amount of cash available to be paid out as dividends does not always match earnings. This means that management may not always have the cash available to pay dividends that are indicated by the earnings per share figure.
Real-Life Plowback Ratio Example
For example, on Nov. 29, 2017, The Walt Disney Company declared a $0.84 semi-annual cash dividend per share to shareholders of record Dec. 11, to be paid Jan. 11, 2018. As of the fiscal year ended Sept 30, 2017, the company’s EPS was $5.73.
Disney’s plowback ratio is, 1 – ($0.84 / $5.73) = 0.8534, or 85.34%.
The retention ratio is the opposite concept to the dividend payout ratio. The dividend payout ratio evaluates the percentage of profits earned that a company pays out to its shareholders. It is calculated simply as dividends per share divided by earnings per share (EPS). Using Disney as an example, the payout ratio is $0.84/$5.73 = 14.66%. This is intuitive as you know that a company keeps any money that it doesn’t payout. Of its total net income of $8.98 billion,
Disney will payout 14.66% and retain or plowback 85.34%. (Source: Disney Co Annual Report)
Bottom Line
When a company pays a higher dividend, one would expect investors to assign it a higher valuation. However, what usually happens is just the opposite. When companies pay higher dividends they get weaker valuations in the market. This is because investors expect the company to reinvest the profit and maintain the same or higher ROE. What is the use of getting a higher dividend if you can’t reinvest it and get the same return as the company’s ROE? Therefore, the better option is to allow the company to reinvest it back into the business, provided the return on equity is better.
One way to interpret the plowback ratio is that a higher ratio makes the company less dependent on debt and equity financing. Retained earnings are usually a better option than debt and equity financing. This is because it does not include any interest payment or default risk. Moreover, unlike with equity financing, the company doesn’t have to worry about the dividend payment or other ways to incentivize investors if it has retained earnings.
Up Next: What Is the Treynor Ratio?
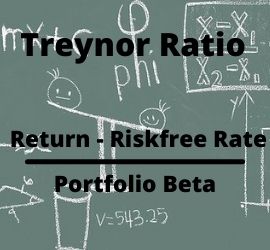
 The Treynor ratio is also known as the reward-to-volatility ratio. It measures the excess returns on a portfolio against what could have been earned on an investment with no diversifiable risk. In other words, it is a performance metric for determining how much excess return was generated for each unit of risk a portfolio carries. Excess return is identified as the return earned above the return of a risk-free investment. In reality, there is no true risk-free investment. However, treasury bills are often used to represent the risk-free return in the Treynor ratio.
The purpose of this ratio is to adjust all investments for market volatility and the risk associated with them. It is an effort to compare investments based on their performance instead of market factors. For example, many investments go up in value together simply because the global economic conditions are exceptional. However, this doesn’t always mean the individual investment is good or the company is performing well. It simply means the market is good and the tide is rising for all stocks. Treynor attempts to change that by placing all investments on the same risk-free footing.


