What Is the Treynor Ratio?
 The Treynor ratio is also known as the reward-to-volatility ratio. It measures the excess returns on a portfolio against what could have been earned on an investment with no diversifiable risk. In other words, it is a performance metric for determining how much excess return was generated for each unit of risk a portfolio carries. Excess return is identified as the return earned above the return of a risk-free investment. In reality, there is no true risk-free investment. However, treasury bills are often used to represent the risk-free return in the Treynor ratio.
The purpose of this ratio is to adjust all investments for market volatility and the risk associated with them. It is an effort to compare investments based on their performance instead of market factors. For example, many investments go up in value together simply because the global economic conditions are exceptional. However, this doesn’t always mean the individual investment is good or the company is performing well. It simply means the market is good and the tide is rising for all stocks. Treynor attempts to change that by placing all investments on the same risk-free footing.
Risk in the Treynor ratio is identified as systematic risk measured by a portfolio’s beta. Beta measures the tendency of a portfolio’s return to change in response to changes in return for the overall market. The Treynor ratio was developed by Jack Treynor, an American economist who was one of the inventors of the Capital Asset Pricing Model (CAPM).
What is the Treynor Ratio Formula?
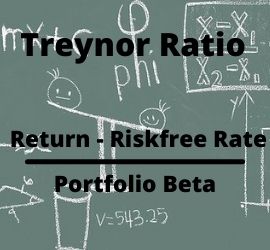
The Treynor Ratio Formula = Rp – Rf / pBeta
Key Terms:
- Rp = Portfolio return
- Rf = Risk-free rate of return
- pBeta = Beta of the portfolio
Treynor Ratio Calculation Example
Suppose you are comparing two mutual funds, Fund A and Fund B. After researching both funds, you still can’t decide which one is a better investment. So, you decide to use the Treynor Ratio. You want to determine if the higher return for Fund A is justified by its higher risk.
Fund A’s total return is 8%, and Fund B’s total return is 6%. The risk-free rate is the return on U.S Treasury Bills, in this case, 2%. From published reports, the Beta for Fund A is 1.25, and Beta for Fund B is 0.8. From this information, the Treynor Ratio computation is as follows.
- Treynor Ratio for Fund A = .08 – .02 / 1.25 = 0.048
- Treynor Ratio for Fund B = .06 – .02 / .8 = 0.050
From the results above, we calculate that the Treynor Ratio for Fund B is slightly higher than Fund A. In general, a higher ratio indicates a more favorable risk vs return scenario. Always remember that Treynor Ratio values use historical data. Therefore, the results are based on past performance and may not be repeated in future performance. Also, it is important to not rely on a single ratio when making investment decisions. Other financial metrics should be considered before making a final decision.
What Is a Good Treynor Ratio Number?
Generally speaking the higher the Treynor ratio the better. Investors always seek a large excess return over the risk-free rate. However, look closely and exercise caution if the Treynor ratios that appear abnormally high. If a Treynor ratio is too large, it could be the result of the beta in the denominator being very small. For example, such a scenario might indicate an incorrectly specified benchmark.
Treynor Ratio for Selecting Mutual Funds
The Treynor Ratio can be useful in shortlisting suitable mutual funds before making the final decision. Typically, a fund with a higher Treynor quota is considered superior to a fund with a lower Treynor ratio. However, it is best to use the ratio based on the characteristics of the portfolio. If you are considering a well-diversified portfolio, the business risk is low. Proper diversification can put the overall portfolio or fund risk very close to the overall market risk. In such a scenario, both the Sharpe and Treynor ratios would give similar results. Both ratios would be expected to rank such funds in the same order.
However, this is not the case if portfolios are not diversified. In the case of non-diversified portfolios, the market risk tends to be the better measure of risk. In this situation, the ranks given by the two ratios might be different. The Treynor Ratio provides additional risk-adjusted performance metrics by taking into account the non-diversifiable element of risk. Sometimes, you may find that adding a new fund only lowers the portfolio’s Treynor ratio. In this case, the conclusion is straightforward. The new fund has only increased the risk of the portfolio without adding to the total return of the portfolio. Therefore, you might want to reconsider your decision and not add the new fund to the portfolio.
Limitations
Investors use the Treynor Ratio as a simple tool to measure the risk-adjusted return potential of a portfolio. However, as an investor, you need to know that this method suffers from several limitations. The Treynor Ratio can be a great way to analyze and identify the best performing investment of a group of funds. But, keep in mind the following:
- The investment should be a subset of the broader portfolio – It is only valid if the specified investment is a subset of the broader portfolio. In cases where the portfolios have similar systematic risk but overall variable risk, the Treynor ratio will rank them the same even though that ranking may not be valid.
- The Treynor ratio uses historical data – The ratio is calculated based on the historical data. This will help you become familiar with the portfolio’s past behavior. However, there is no guarantee that it will continue to behave the same way in the future. Market dynamics constantly change. So, the portfolio may become more or less vulnerable depending on the volatility of the underlying securities. Therefore, the Treynor ratio cannot be a mirror that reflects the future potential of a portfolio.
- Use in combination with other metrics – You should use the Treynor ratio in combination with other ratios to make an accurate decision. Imagine a portfolio that has had an average return of 9-11% over the past five years and a beta of 1.25. There is no guarantee that the portfolio will perform in the same way in the years to come. The return can go up or down depending on economic factors.
Final Words
The Treynor ratio has an inherent weakness in that it is backward-looking by design. It’s quite possible, perhaps even expected, for an investment to perform differently in the future than it has in the past. A stock with a beta of three won’t necessarily have three times the volatility of the market forever. Likewise, you shouldn’t automatically expect a portfolio to generate 10% returns over the next decade simply because it returned 10% over the previous decade. In addition, some may take issue with the use of beta as a measure of risk. Many academics, as well as investors, would argue that beta is not risk. Warren Buffett and Charlie Munger both claim that the volatility of an investment is not a true risk. They argue that risk is the chance of a permanent, not temporary, loss of capital.
Ratios that include Beta may be best suited for comparing short-term performance. A number of studies of long-term stock market performance — and a study of Buffett’s record at Berkshire Hathaway — have shown that low beta stocks have actually performed better than high beta stocks, whether on a risk-adjusted basis or in terms of raw, unadjusted performance. That is to say that the direct and linear relationship between higher beta and higher long-run returns may not be as strong as it is believed to be. Academics and investors will invariably argue the best methods for measuring risk for years to come. In truth, there may be no perfect measure of risk. But despite this, the Treynor ratio can at least give you a way to compare the performance of a portfolio per unit of beta, which may make for more useful comparisons than an unadjusted comparison of performance. (Source: fool.com)
Up Next: What Is Idiosyncratic Risk?
 Idiosyncratic risk is a type of investment risk that is specific to an individual asset like a particular company’s stock. It can also affect a group of related assets like a particular sector’s stocks. And, in some cases, a very specific asset class like collateralized mortgage obligations. Idiosyncratic risk is also referred to as a specific risk or unsystematic risk. This type of risk is rooted in individual companies or individual investments. Therefore, idiosyncratic risk can generally be mitigated in an investment portfolio through the use of diversification.
The opposite of idiosyncratic risk is a systematic risk. Systematic risk is the overall risk that affects all assets in the entire financial system. This could be due to fluctuations in the stock market, interest rates, or the entire economy. It refers to broader trends that impact the overall financial system or a very broad market.