What is a Dragonfly Doji Candlestick Pattern?
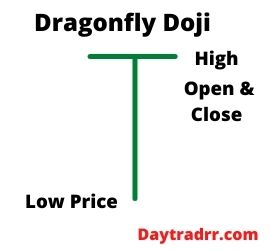 A dragonfly doji candlestick pattern forms when a trading candlestick has the same high, open, and closing prices forming a capital letter “T”
The Dragonfly Doji is typically interpreted as a bullish reversal chart pattern when it occurs at the bottom of a downtrend. Correctly identifying the Dragonfly Doji can help traders see where support and demand are located. This information can then be used with other indicators to identify a possible uptrend.
In general, a Dragonfly Doji can signal a potential reversal in price to the downside or upside, depending on past price action. It forms when the asset’s high, open, and close prices are the same. A long lower shadow suggests aggressive selling during the period of the candle. The long lower shadow implies that the market tested where demand was located and found it. However, because the price closes near the open, it shows that buyers were able to absorb the selling and push the price back up.
Following a downtrend, the dragonfly candlestick may signal a reversal and a price rise is emerging. However, when following an uptrend, it shows more selling is entering the market and a price decline could follow. In either case, the candles following the dragonfly doji need to confirm the direction. The greater the subsequent volume, the stronger the confirmation signal.
What Does the Dragonfly Doji Reveal?
The dragonfly doji pattern is relatively rare and does not appear very often. When it does, it is a sign of indecision and a potential warning indicator that the trend may reverse.
Following a price increase, the dragonfly’s lengthy bottom shadow indicates that sellers were able to gain control for at least part of the trading session. Although the price ended up remaining steady, the increase in selling pressure over the period is a red flag. The candle from the next trading session must be consulted to confirm the turnaround. The candle that follows must dip and close below the dragonfly closing price. If the price increases on the confirmation candle, the reversal signal is negated with no indication of a new trend.
Following a price decline, the dragonfly doji indicates that sellers were present early in the session. However, towards the end of the session, buying pressure moved the price back to the open. The key takeaway is that increased buying pressure during a decline may predict a price increase. The signal is confirmed if the candle that follows the dragonfly rises and closes above the dragonfly’s closure in the next trading session. The bigger the rally on the day after the bullish dragonfly, the more likely the reversal. Traders often enter trades during or shortly after the completion of the confirmation candle.
- Opening long – When entering long on a bullish reversal, a stop loss might be placed below the dragonfly’s low.
- Opening short – When entering short after a bearish reversal, a stop loss might be placed above the dragonfly’s high.
Check other indicators for confirmation
It is critical to consider the big picture rather than focusing on a single candlestick. As a result, the dragonfly doji works best when combined with other technical indicators. This is especially true as the candlestick pattern can be interpreted as uncertainty as well as an outright reversal pattern. A dragonfly doji with a high volume is more trustworthy than one with a low volume. The confirmation candle should ideally have a strong price move as well as a strong volume. Furthermore, the dragonfly doji may appear as part of a bigger chart pattern, such as the end of a head and shoulders pattern.
Example of How to Use the Dragonfly Doji
A Dragonfly Doji is extremely rare. It is very uncommon for the opening price, high, and close to all be the same price. Typically, there are some differences between these three prices, sometimes quite a lot. Nevertheless, a dragonfly doji can happen during a sideways correction within a longer-term rally. Following the dragonfly, look for the price to rise on the next candle. This would be another indication confirming that the price could be reversing upward. Traders would typically go long and buy during or immediately following the confirmation candle. A stop-loss order can be put below the dragonfly’s low. In the larger picture, the dragonfly pattern and the confirmation candle can indicate that the short-term correction had ended and an uptrend may be starting.
Dragonfly Doji in Uptrend (or at Top – Reversal)
When a trend is bullish doji candles show indecision between buyers and sellers. As such, proceed with caution. When you identify a dragonfly doji candle in an uptrend, it shows bears and bulls don’t know where the price is going. It further indicates indecision or uncertainty in the market.
Dragonfly doji candlestick gives you a sign of a price reversal 50% of the time or ranging before the price continues its upward movement. Many pro traders believe that you should confirm dragonfly doji candle price action with the next candlestick on every chart. (Source: tratingindepth.com)
Dragonfly Doji in Downtrend (or at Bottom – Reversal)
Dragonfly doji candle has a different meaning in a downtrend. When the price trend is downward, this candlestick shows bears pulling the price down. However, upward buying pressure pushes it back up to close almost precisely at the opening price.
In other words, dragonfly doji candle can means price exhaustion in a downtrend and potential price reversal. Moreover, You should pay attention to when and where this candle forms and if it’s near the support zone in a chart. This support zone could be a specific Fibonacci level, lower band of Bollinger, moving average line, or historical support level. (Source: ibid)
The Difference Between the Dragonfly Doji and the Gravestone Doji
The bearish version of the Dragonfly Doji is the Gravestone Doji. It looks like an upside-down version of the Dragonfly and it can signal a possible downtrend. com
A gravestone doji occurs when the low, open, and close prices are the same. However, the candle has a long upper shadow, so the gravestone looks like an upsidedown “T.” The implications for the gravestone are the same as the dragonfly. Both indicate possible trend reversals but must be confirmed by the candle that follows during the next trading session.
Limitations
Although the Dragonfly Doji can indicate the coming of a bullish price change, traders should not rely on this indicator alone.
- Limited data – True Dragonflies are very rare since open, high, and closing prices are rarely ever the same.
- Seek confirmation – Successful traders will typically wait until the following day to verify the possibility of an uptrend after a Dragonfly.
- Can also signal a downtrend – If the Dragonfly appears after a pricing uptrend, it can indicate that a price decline may follow.
- Greater reliability with higher trading volume – A Dragonfly accompanied by higher-than-usual volume is more reliable than one with low volume.
- Check other indicators – Other indicators should be used in conjunction with the Dragonfly Doji pattern to determine potential buy signals. com
Because the dragonfly doji rarely occurs, it is not a reliable technique for detecting most price reversals. Even when it does happen, it isn’t always consistent. As a result, there is no guarantee that the price will continue to move in the expected direction after the confirmation candle.
The size of the dragonfly coupled with the size of the confirmation candle can sometimes mean the entry point for a trade is a long way from the stop loss location. This means traders will need to find another location for the stop loss, or they may need to forgo the trade since too large of a stop loss may not justify the potential reward of the trade. Estimating the potential reward of a dragonfly trade can also be difficult since candlestick patterns don’t typically provide price targets. Other techniques, such as other candlestick patterns, indicators, or strategies are required in order to exit the trade when and if profitable. (Source: investopedia.com)
Up Next: What Is a Habendum Clause?
 The habendum clause in a deed, lease, or mineral rights contract defines the interests, property rights, and specific details of ownership.
A habendum clause is a contract provision. It deals with property rights, interests, and other aspects of ownership granted to one of the parties to a transaction. It is typically seen in property-related documents and consists of basic legal jargon. Most buyers and sellers are familiar with it through real estate transactions. However, it is also used in a variety of leases and agreements, particularly in the oil and gas business. The habendum clause is also known as the to have and to hold clause. This is because it usually begins with the words “to have and to hold.”