What is a Triple Bottom Pattern?
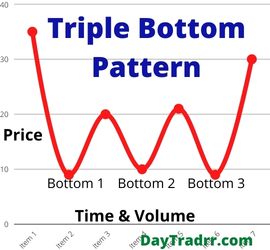
 A triple bottom pattern is a bullish reversal at the end of a downtrend comprised of three lows before a breakout above the resistance level.
A triple bottom pattern is a bullish chart pattern. Technical analysts define it as three equal lows followed by a breakthrough over the resistance level. When it occurs at the end of a downtrend, a triple bottom indicates a bullish reversal pattern. The interpretation is that sellers failed to breach the support level three times in a row. Therefore, this candlestick pattern indicates an imminent change in trend direction. The first bottom line does not reveal anything unusual. Still, as the price breaks through the resistance, the second and third bottoms reflect a shift in direction, with buyers (bulls) gaining momentum and pushing the price upward.
Triple Bottom Pattern – A Closer Look
The triple bottom chart pattern usually occurs after a protracted downward slump in which the market is dominated by bearish sentiment. The first bottom might simply be regular market fluctuation. However, the second bottom is interpreted by technical analysts as the bulls are building momentum. Possibly, they are positioning themselves for a probable turnaround. When the price breaks through resistance levels, the third bottom signals that significant support is in place, and bears may concede. To qualify as a genuine triple bottom, there are a few rules that are widely used:
- Existing downtrend – Before the pattern appears, there should be an established decline.
- Equivalent lows – The three lows should be roughly equal in price and spaced out from each other. The prices do not have to be precisely the same. However, they should be relatively near enough that a trendline may be drawn horizontally.
- Declining downward pressure – Bearish volume should decline throughout the pattern indicating that bears are losing strength. However, the bullish volume should rise. Particularly when the price breaks through the final resistance.
Spotting the Triple Bottom Pattern
The triple bottom is somewhat rare to encounter. Nevertheless, it is simple to recognize in spite of its rarity. A downtrend, defined as a succession of lower lows and lower highs, is the first thing to watch for. Three failed tries to break lower in succession generally stand out on the chart. By comparison, a double bottom is a more common chart pattern. It is the break of resistance that confirms the pattern and makes it a reversal pattern. A support level is formed during the fluctuation period. This forms a trading range between the lows and overhead resistance. The triple bottom pattern, which is a technical buy signal, is confirmed by an upside breach of this barrier.
The Triple Bottom Reversal can mimic a variety of patterns as it develops. The pattern may resemble a Double Bottom Reversal before the third low emerges. A falling triangle or rectangle can also have three equal lows. Only the descending triangle has bearish undertones among these patterns. The rest are neutral until a breakout occurs. Similarly, until a breakthrough occurs, the Triple Bottom Reversal should be considered as a neutral pattern. Although the ability to retain support is positive, demand will not maintain momentum until resistance is breached. The volume on the previous advance might occasionally give you a hint. The odds of a breakthrough significantly increase if volume and momentum both increase sharply.
How to Trade a Triple Bottom Pattern
A triple bottom pattern is considered a reliable tool by technical traders. It allows them to find the reversal within the trendline. But, also to calculate how far that trend will likely go once it’s established. Traders should treat the triple bottom pattern as a neutral pattern until the breakout is confirmed. Once the upper resistance level is broken with a sharp increase in volume, the momentum will likely carry the price action higher
- Double bottom – The gap between the lows and the breakout point plus the breakout point itself is usually the price objective for a double bottom turnaround. As an example, if the low is $20.00 and the breakout point is $24.00. In this case, the price objective would be (24 – 20 = 4 + 24 = 28) $28.00 . Stop-loss levels are typically set immediately below the breakout point and/or triple bottom lows.
- Triple bottom – This is a chart pattern that looks like ascending or descending triangles and is related to the double bottom chart pattern. Traders use additional technical indicators or chart patterns to validate the existence of a triple bottom. Before forming a double bottom, traders could notice an oversold relative strength index (RSI) and/or check for a breakout to ensure that it’s a triple bottom and not a descending triangle or another bearish pattern.
Triple Bottom Pattern vs a Triple Top
The triple top is the opposite of the triple bottom pattern. A triple top, rather than being a bullish reversal, is a bearish reversal pattern. The upward price movement bumps off the resistance level three times, setting three approximately identical highs. But then, it moves sharply downward before crashing through resistance. The triple top and the triple bottom are basically mirror patterns of the same market occurrence. They demonstrate a protracted war for power between bulls and bears, with one side eventually emerging victorious. A triple bottom or top will simply become a longer-term range if no winner emerges.
The triple bottom shows that a downtrend exists, and it is currently in the process of reversing into an uptrend. However, because selling pressure is waning, the downtrend is losing steam. It is widely considered that, like with a triple top, the longer a trend takes to completely develop, the bigger the price movement once a breakdown happens.
Limitations of a Triple Bottom
Technical analysis deals with probabilities and not certainties. As a result, there’s always some caution and doubt when trading chart patterns. The triple bottom, like most patterns, is simplest to spot after the trade opportunity has passed. Double bottoms can fail and form a triple bottom. Also, the head and shoulders pattern and the triple bottom can easily be one and the same. However, due to the positioning of the target and stop-loss, the most frequently mentioned disadvantage of a triple bottom is that it does not offer a good risk-reward balance. Traders can increase their profit potential by placing their stop loss inside the pattern and trailing it up when the breakout occurs. The problem with this is that you’re more likely to get stopped out of the range for a modest loss.
Up Next: Revenue Vs. Profit – Overview
 Revenue vs. profit – what’s the difference? Revenue is income generated through business operations while profit is net income after deducting expenses from earnings. Profit and revenue are two very important numbers to focus on for business owners and stock investors alike. Revenue is the total amount of money the company earns in a given period. Profit is what’s left after expenses have been deducted. In other words, revenue describes income generated through business operations, while profit describes net income after deducting expenses from earnings. Revenue can take various forms, such as sales, income from fees, and income generated by property and rents.
However, a company can bring in large amounts of revenue, but there will be no remaining profit if expenses exceed revenue. Revenue refers to the entire amount of money earned through the sale of goods or services connected to the company’s principal business. Profit, also known as net profit or the bottom line, is the amount of money left over after all expenses, debts, extra revenue sources, and operational costs have been deducted. These two phrases are often used interchangeably, so it is important to understand the distinction between revenue vs. profit. Considering this, a corporation might produce considerable revenue while running at a net loss.


