What is a Reverse Head And Shoulders Pattern?
 A reverse head and shoulders pattern is a technical charting indicator associated with a bullish, upward reversal of a downward price trend.
The reverse head and shoulders pattern is also known as a head and shoulders bottom. The formation is similar to the standard head and shoulders pattern, but inverted. The head and shoulders top is used to predict reversals in downtrends. Conversely, the head and shoulders bottom is used to predict reversals in uptrends. When a security’s price action fits the following criteria, this pattern is identified. First, the price falls to a trough and then rises. However, the price falls below the earlier trough yet to rise again. Finally, the price falls but not as far as the second trough. Following the completion of the final dip, the price begins to rise, aiming for resistance at the tops of the prior troughs.
The reverse head and shoulders pattern is used as a signal. Technical analysts believe this pattern to be one of the most typical signs of a downward price trend reversal. As the price falls, it reaches a low point (a trough), after which it begins to recover and swing higher. The market then pulls it back and down into another trough due to market resistance. Price falls to a point where the market can no longer accept lower prices, and it begins to rise again. However, market opposition pulls the price down once again, and the price drops for the final time. But, the market can’t support a lower price, so it doesn’t reach the prior low before prices rise again. This movement creates three troughs or low points which resemble a left shoulder, head, and right shoulder.
Spotting the Reverse Head and Shoulders Pattern
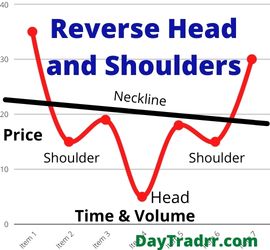
Among technical traders, the head and shoulders pattern is undoubtedly one of the most popular reversal patterns. It resembles a neckline with three peaks. The central peak is the tallest of the three resulting in the comparison to a head and shoulders configuration. As a result, the three tops resemble two shoulders with a head between them. The standard head and shoulders configuration, as well as the inverse head and shoulders formation, are both reversal patterns. There are three factors that are associated with the patterns:
- Shoulders – Left and right shoulders are two peaks that sit on each side of the main peak. They should ideally be symmetrical, meaning they should be at or near the same price level. Asymmetrical shoulders are usually tough to spot. They’re acceptable as long as the space between the two peaks isn’t too great.
- Head – This is the formation’s highest point in the conventional formation. Or, the lowest peak in the reverse head and shoulders variation. The head should be the most prominent peak than the two peaks on either side in both variations.
- Neckline – A neckline is a trend line that joins the bottoms of the two shoulders. When the price crosses the neckline, it triggers the pattern.
The traditional head and shoulders pattern and the inverse formation are distinguished by the fact that they occur on opposing sides of the chart. The traditional head and shoulders pattern is a bearish reversal pattern. It indicates that the uptrend has reached its peak and that the reversal has begun. Particularly, when the succession of rising highs is broken by the third peak, which is lower than the second.
What Does a Reverse Head And Shoulders Tell You?
When the price climbs above the neckline’s resistance, investors often take a long position. The shoulders are formed by the first and third troughs, while the head is formed by the second peak. A rise over the resistance level, often known as the neckline, potentially signals a rapid upward surge. Many traders look for a significant increase in volume to establish the breakout’s veracity. This pattern is the opposite of the well-known head and shoulders pattern, which is used to forecast downtrend movements rather than uptrend shifts.
A reasonable profit goal may be determined by calculating the distance between the bottom of the head and the pattern’s neckline. Then, projecting how far the price may move in the breakout direction using that same distance as a guide. The profit objective is set ten points above the pattern’s neckline, for example, if the distance between the head and neckline is 10 points. Below the breakout price bar or candle, an aggressive stop-loss order might be set. Alternatively, a conservative stop-loss order might be placed below the inverted head and shoulders pattern’s right shoulder. The identifying elements of an inverted head and shoulders pattern are as follows:
Identifying the Torso
- Prior Trend – For this to be a reversal pattern, it is necessary to show the presence of a preceding downturn. There can’t be a Head and Shoulders Bottom without a previous downturn to reverse.
- Left shoulder – After long bearish trends, the price falls to a trough and subsequently rises to form a peak.
- Inverted head – The price falls again to form a second trough substantially below the initial low and rises yet again.
- Right shoulder – The price falls for the third time, but only to the level of the first trough, before rising once more and reversing the trend.
- Neckline – The neckline might slope up, down, or be horizontal depending on the connection between the two response highs. The degree of the bullishness of the pattern is determined by the slope of the neckline: an upward slope is more bullish than a downward slope.
Trading a Reverse Head and Shoulders Aggressively
Just above the neckline of the inverse head and shoulders pattern, a buy-stop order can be placed. This assures that the investor enters on the first break of the neckline, capitalizing on the upward trend. However, the risk of a false breakout and increased slippage in order execution are disadvantages of this technique.
Trading a Reverse Head and Shoulders Conservatively
To avoid a false breakout, an investor might wait for the price to close above the neckline, essentially confirming the validity of the breakout. An investor can enter on the first closing above the neckline using this approach. A limit order can also be placed at or just below the broken neckline as protection against a price retracement. Waiting for a retrace is likely to result in less slippage. However, if a retreat does not materialize, the trade may be missed.
The Difference Between An Inverse Head and Shoulders and a Head and Shoulders
The conventional head and shoulders chart is the opposite of a reverse head and shoulders chart. It is used to anticipate up-trend reversals and is the mirror image of an inverted head and shoulders chart. It is identified when the price of a security climbs to a peak and then falls. Then, the price rises above the prior high and then falls again. Finally, the price rises again but not as far as the second peak. After reaching the last peak, the price begins to fall, aiming for resistance at the bottom of the prior peaks.
Among technical traders, the head and shoulders pattern is one of the most popular reversal patterns. The name is derived from the resemblance of a head and shoulders from a baseline with three peaks. The central peak is the tallest of the three. Therefore, it’s termed the head. The three tops resemble a left shoulder, a head, and a right shoulder, respectively.
Limitations
Technical traders believe the ups and downs of the head and shoulders pattern convey a unique tale of conflict between bulls and bears. The negative trend’s developing strength into the first shoulder part is shown by the initial drop and subsequent peak. Bears want to push the price back down through the initial trough following the shoulder to hit a new low in order to prolong the bearish trend. This forms the head. It’s still feasible that bears might reclaim market dominance and extend the downward trend at this point.
However, it is apparent that bulls are gaining ground after the price rises a second time and reaches a level above the previous peak. Bears attempt a third time to push price lower, but only manage to reach the lesser low set in the initial trough. The inability to reach the lowest low signifies that the bears may have run out of steam. At this point, the bulls take control, propelling the price upward and completing the reversal.
Up Next: What is a Triple Bottom Pattern?
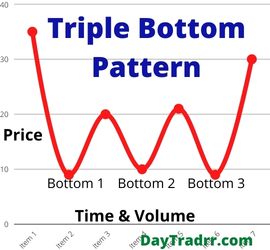 A triple bottom pattern is a bullish reversal at the end of a downtrend comprised of three lows before a breakout above the resistance level.
A triple bottom pattern is a bullish chart pattern. Technical analysts define it as three equal lows followed by a breakthrough over the resistance level. When it occurs at the end of a downtrend, a triple bottom indicates a bullish reversal pattern. The interpretation is that sellers failed to breach the support level three times in a row. Therefore, this candlestick pattern indicates an imminent change in trend direction. The first bottom line does not reveal anything unusual. Still, as the price breaks through the resistance, the second and third bottoms reflect a shift in direction, with buyers (bulls) gaining momentum and pushing the price upward.