

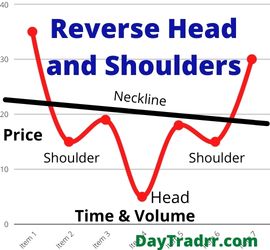
What is a Reverse Head And Shoulders Pattern? A reverse head and shoulders pattern is a technical charting indicator associated with a bullish, upward reversal of a downward price trend. The reverse head and shoulders pattern is also known as a head and shoulders bottom. The formation is similar to […]
Investing
221 posts
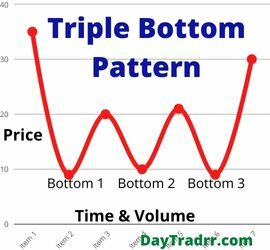
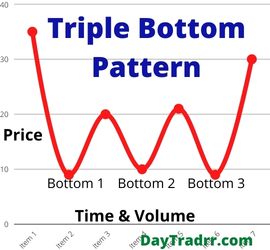
What is a Triple Bottom Pattern? A triple bottom pattern is a bullish reversal at the end of a downtrend comprised of three lows before a breakout above the resistance level. A triple bottom pattern is a bullish chart pattern. Technical analysts define it as three equal lows followed by a breakthrough […]

Revenue Vs. Profit – Overview Revenue vs. profit – what’s the difference? Revenue is income generated through business operations while profit is net income after deducting expenses from earnings. Profit and revenue are two very important numbers to focus on for business owners and stock investors alike. Revenue is the […]

What is a Stash Party? A Stash Party refers to a Stash Stock Party offered by Stash Investments LLC as part of their Rewards Program for Personal Portfolio Holders. Participants may earn fractional shares of stock from featured publicly-traded companies and/or exchange-traded funds. By attending a Stash Stock Party, Stashers […]

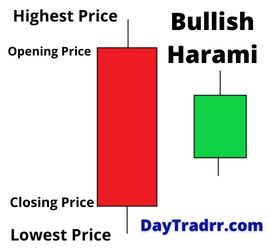
What Is a Bullish Harami? A bullish harami is a simple candlestick chart pattern that indicates the reversal of a bearish trend in an asset or market. A smaller body on the next candle must close higher within the body of the previous day’s candle to form a bullish harami. […]

What is a Dead Cat Bounce when Investing? A dead cat bounce is an investment phrase. It refers to a brief increase in the price of a stock or other asset amid a lengthy period of decline. The name derives from the concept that even a dead cat will bounce […]