What Is a Bull Trap?
 A bull trap is a false signal. It refers to a declining trend in a stock, index, or other security. The reversal occurs after a convincing rally that breaks a prior support level. This scenario traps traders or investors who act on the buy signal. As a result, they generate losses from the long positions they establish. A bull trap is also a whipsaw pattern. The opposite of a bull trap is a bear trap. This occurs when sellers fail to press a decline below a breakdown level.
A bull trap denotes a bearish reversal. Market participants on the wrong side of the price action must exit positions with unexpected losses. Bull traps occur when buyers fail to support a rally above a breakout level. Traders and investors can protect themselves by seeking confirmation following a breakout. Useful tools are technical indicators and pattern divergences.
In other words, a bull trap is a reversal against a bullish trend. The reversal forces long traders to abandon their positions in the face of rising losses. It is called a trap because it often catches traders off-guard. A bull trap usually comes on the back of a strong market rally that looks likely to continue. It occurs when a trader buys an asset as it breaks through a historically high level of resistance. Often, breakouts above resistance are followed by increasingly higher highs. However, a bull trap experiences a bearish reversal soon after the breakout.
Bull Trap – A Closer Look
A common technical trading strategy is to buy a stock or security that breaks out above a resistance level. This is because many breakouts are followed by strong moves higher. Occasionally though, the security may quickly reverse direction. A bull trap occurs when a trader or investor buys a stock or security that breaks out above a resistance level. However, instead of continuing higher, it quickly makes a bearish reversal. These are known as bull traps because traders and investors who bought the breakout are trapped in the trade.
Traders and investors can avoid bull traps by looking for confirmations following a breakout. For example, a trader may look for higher than average volume and bullish candlesticks following a breakout. This can help to confirm that the price is likely to move higher. A breakout that generates low volume and indecisive candlesticks could be a sign of a bull trap.
From a psychological standpoint, bull traps happen when bulls fail to support a rally above a breakout level. This could be due to a lack of momentum or profit-taking. Bears may then jump on the opportunity to sell the security if they see divergences. The result is sagging prices below resistance levels which can then trigger stop-loss orders. The best way to handle bull traps is to learn to recognize warning signs ahead of time. Exit the trade as quickly as possible if a bull trap is suspected. Stop-loss orders can be helpful in quickly moving markets. With clear entry and exit points in place, traders can avoid letting emotion drive decision-making. (Source: investopedia.com)
What Happens During a Bull Trap
A bull trap is most likely to occur after a long bullish trend. This is a sustained upward movement of the price that has been active for a long time. It means that buyers have been in control for a prolonged period and may eventually exhaust their resources. This assumption becomes confirmed when the price eventually enters a resistance zone. The price usually slows down as shorter candlesticks start forming on the trading charts. Analysts can match this occurrence to a significant number of long traders taking their profits at the resistance level.
The market slows down before more buyers jump in to push the price past the zone of resistance. This leads to the formation of a breakout. Unsuspecting buyers see this as a continuation of the uptrend and they execute more buy trades. However, many buyers have exhausted their resources. As a result, the sellers start pumping in orders dominating these strong resistance zones. The keen buyers who know this phenomenon start closing their trades. The sellers, upon seeing reducing buyer volumes, pump in more sell trades.
The resulting imbalance of escaping buyers and aggressive sellers causes the trend to tilt in favor of the sellers. As the trend dips lower, it takes out the stop losses of the new buyers, making the sellers even stronger. The buyers who thought that the trend would continue rallying upwards have their stop losses activated. Those with wider stops, or without any stops, remain trapped in a trend that has turned against them. (Source: mitrade.com)
Bull Trap Order Flow
To fully understand the dynamics of the bull trap, consider the order flow and the thought process behind a bull trap. Here are the individual phases:
- Prelude – a long sell-off or stagnant period where people missed profit opportunities and/or are becoming too greedy and want more.
- Uptrend – Then the price sets up a new trend wave that lures people into entering new positions. It looks like the price is starting a new trend wave by breaking the previous lows.
- False confirmation – The price goes a little in the favor of those ‘trapped’ traders, creating a feeling of confidence and security.
- Reverse to the downside – People in disbelieve hold on to their trades that are suddenly turning into a loss. Others add to their loss, hoping to average down.
- Downside accelerates – Price slides further and the trapped short traders are now facing huge losses. Most are forced out of their long trades which means that they have to buy which accelerates the rally.
The bull or bear trap is more than just a trading pattern. It is helpful to visualize and understand how the average trader approaches the markets. It can be a further lesson as to why the professionals usually win. (Source: tradeciety.com)
How to Escape a Bull Trap
The best way to escape a bull trap is to set a narrow stop-loss on your position as you open it. This will help you to prevent heavy losses if you’re caught out by a bull trap. There are a few kinds of stop-losses to choose from, including standard, trailing, or guaranteed. When trying to avoid a bull trap, a trailing stop would probably help you the most. This is because the stop order trails behind the current market value by a set amount of points. The stop order will automatically close your position if the market value falls by that set amount. As a result, you can lock in as much profit as possible, but cut losses early into a bull trap. (Source: ig.com)
Example
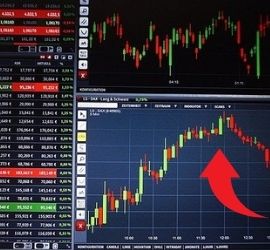
In this example, the stock enjoys a long bullish trend with sustained upward price movement for a long time. After meeting a period of resistance, the price breaks out again as indicated by the red arrow in the illustration. The breakout occurs on high trading volume, rising above trendline resistance.
Many traders and investors jump on to the move, anticipating a continued breakout above trendline resistance. But, as seen in the example, the security reverses and turns sharply lower from these levels. New bulls get trapped in long trades and incur rapid losses. Aggressive risk management techniques are necessary to mitigate losing trades. It is possible that the trader or investor could have avoided the bull trap by waiting for the breakout to unfold before jumping in. At the very least, losses can be minimized by setting a tight stop-loss order just below the breakout level.
How to Identify a Bull Trap
It’s hard to identify a bull trap. In many cases, an asset will likely increase in price after a breakout, not reverse. However, what you can do is carry out technical analysis and fundamental analysis on the asset you want to trade. Look for whether the asset is currently overbought. This can indicate a bearish reversal from the prevailing bullish trend. You could also wait before opening a long position following a breakout, to verifybullish trend continues. (Source: ig.com)
Final Words
- A bull trap is a reversal from an upward trend shortly after an asset breaks through a historical level of resistance
- Normally, a breakout above the resistance might indicate that the prevailing trend will continue but this isn’t the case in a bull trap
- Traders might take a breakout above resistance as a signal to go long and buy the underlying market
- If this is the case, bear traps could result in a trader losing money as the price falls after opening a long position
- Stop-losses – particularly trailing stops – can help you to avoid bear traps and their negative effects on profits in your trading (Source: ibid)
Day trading can be summarized simply as buying security. Then, quickly selling or closing out the position within a single trading day. Ideally, day traders want to “cash-out” by the end of each day with no open positions This lets them avoid the risk of losses by holding security overnight. Day trading is not for everyone and carries significant risks. It requires an in-depth understanding of how the markets work and various strategies for profiting in the short term. Short-term profits require a very different approach compared to traditional long-term, buy and hold investment strategies.