What is Net Change?
 Net change refers to the difference in the closing price of a stock, bond, or other traded financial instrument from one period to the next.
In general, net change is the difference between a previous value and its current value. In the stock market, it most commonly refers to the prior trading period’s closing price and the current trading period’s closing price for a given security. For stock prices, the net change usually refers to a daily time frame. Therefore, the net change can be positive or negative for the given day in question. The change for stocks and most securities are quoted in U.S. Dollars when reported by financial media. However, the change can be calculated and quoted in any denomination depending on what is being traded and reported.
In other words, the net change is the difference between the closing price of a prior trading period and the closing price of the current trading period for a financial security. The measure is generally used for stock prices, bond prices, mutual funds, derivative products, and other tradeable securities. It usually refers to the daily change in price and represents the most common data represented for financial quotes. All trading platforms and real-time market data providers show net change when quoting prices. It is also an important information source for technical analysis. The change can be positive or negative. Therefore, it represents whether the markets are up or down from the previous day.
Net change in shares trading
While it can be used in a range of markets, the net change is most commonly used in share trading. Traders will often use this measure to assess the daily deviations in a stock’s price. They can then use this information to determine if they should open a long or short position. Of course, it usually depends on whether the change is positive or negative. Net change can also help a trader decide if they should close their active positions. It can be an indicator of which way the markets might move during the current trading session.
Net Change – A Closer Look
Technical analysts use net change to chart and analyze stock prices over time in line charts. For example, a stock might close at $20.00 the prior session and $20.50 in the current session. This translates to a change of +$0.50 per share. Many investors also look at the net change in the context of a percentage change. This provides a look at how significant the movement is relative to the price.
There are some instances, however, when electronic information or historical data may not be updated after being inaccurately reported. So, it’s important for investors to double-check that the net change is correct when doing research on historical prices.
Net Change Formula
Net Change formula is used in order to calculate the change in the value of anything from its previous values. It is mainly used for calculating the change in the closing price of the stocks, mutual funds, bonds, etc. from its closing price on the previous day.
In the stock market, it is used as the measure to calculate the difference between the current closing prices with the previous period’s closing price over the given period of time. If required, it can also be calculated in percentage terms by the user.
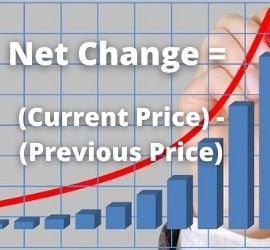
The formula is represented as below:
Also, in percentage terms, the formula is mathematically represented as below:
Defining terms:
- Current Period’s Closing Prices = Closing price at the end of the period when the analysis is done.
- Previous Period’s Closing Price = Price at the beginning of the period for which analysis is to be done.
(Source: wallstreetmojo.com)
How to Calculate the Net Change
You can calculate net change by subtracting the current day’s closing price for any asset from the closing price of the previous day. For example, consider a company’s stock that closes at $250 per share today after closing at $255 the previous day. In this case, there has been a negative net change of -$5. From this and other data, you might conclude this is the beginning of a negative trend decide to go short. However, what if the price had increased to $260, up from $255 yesterday? In that case, there is a positive net change of +$5. Often the net change includes a + or – sign to make the direction of the change clear.
The difference between prices from different time periods is reported as the net change. But, it can also be referred to as simply change or price change. When an asset gains value, the positive net change is expressed with a plus sign, for example, +1.50. This usually represents US$ 1.50. However, it can represent any other denominated currency as well. If an asset loses value, the negative net change is expressed with a negative sign, -1.50.
The difference can also be expressed as a percentage amount. In fact, a percentage amount is more useful because it shows the relative return that is not captured by the absolute price change. It makes comparing net changes between assets easier on a percentage change basis.
Net Change and Stock Quotes
Many stock market apps and newspapers publish watch lists and stock tables. These include the company name, ticker symbol, volume, high, low, close, and net changes for the previous session. Additional information, such as the 52-week high, 52-week low, dividend yield, yield percentage, and price-earnings ratio may also be included. Because quotes get retrieved from multiple exchanges, stock data may differ slightly.
Technical analysts use electronic stock quotes rather than delayed stock market apps and newspapers. This is because they provide real-time information. In these cases, the net change is typically displayed next to the current price along with the percentage change. For example, an electronic quote may look something like 153.50 -0.50 (-22%). The first number is the last trading price, the second number is the net change, and the third number is the percentage change.
Technical Analysis
Net change is very important in technical analysis. Technical analysis is a trading discipline to evaluate and identify trading opportunities based on historical statistical data. This information is gathered from trading history. Analysts attempt to evaluate securities based on their historical price movements and volume trends. On the other hand, fundamental analysis focuses on evaluating securities based on their underlying business performance, such as earnings. Technical analysis charts the price history of assets in order to evaluate securities. As a result, the change in price is very important within the discipline. Therefore, this measure of change is often detailed in various stock charts.
Technical analysis traders utilize the charts to identify trends in prices and volume. By analyzing the historical trends, the traders try to predict where the directional patterns will trend in the future. The net change represented in charts allows these traders to identify patterns and trends. Ultimately, they believe it will lead to buy and sell signals they can enter trades with.
Point-and-Figure Charts
Most stock charts plot a security’s closing price over time and optimize around a daily time frame. However, Point-and-Figure charting focuses entirely on net change. This is without respect to the current price, time, volume, or any other factor. Point and figure charts represent filtered price movements rather than the actual price of a security to show trends.
Point & Figure charts consist of columns of X’s and O’s that represent the price movements. X-Columns represent rising prices and O-Columns represent falling prices. Each price box represents a specific value that price must reach to warrant an X or an O. Time is not a factor in P&F charting. These charts only evolve as prices move. No movement in price means no change in the P&F chart. They’re based solely on price change rather than time. Therefore, these charts display directional patterns and trends in a condensed visual format. It spares chartists the tedious task of looking over much longer timelines.
Before computers, P&F charts were popular. Their simplicity made it easy to maintain a large collection of charts. Using just a pencil, a newspaper, and some graph paper, chartists could update and analyze 50 or more charts every day in less than an hour. This classic manual method was all but abandoned as technology made charting easier.
Up Next: What Is a Purchase Money Security Interest (PMSI)?
 A Purchase Money Security Interest (PMSI) is a security agreement where a lender loans purchase money for certain goods which are then pledged to the lender as collateral for the loan. In other words, the lender uses the goods purchased as collateral to secures the repayment of the debt owed.
Purchase money security interest (PMSI) is a legal agreement that allows a lender to either repossess property financed with its loan or to demand repayment in cash if the borrower fails to pay. When properly executed, it gives the lender priority over claims made by other creditors. However, the procedures permitting enforcement of a PMSI are strict and outlined in the Uniform Commercial Code.
According to UCC Article 9, a purchase money security interest (PMSI) is a special type of security interest. It enables lenders who finance a debtor’s acquisition of goods to acquire a first priority security interest in the collateral. Even if another creditor holds an earlier perfected security interest, the PMSI secured party would take priority. A PMSI is often used by a seller of goods. It allows them to secure the prices and advance the funds that enable the debtor to acquire the goods. However, the super-priority for the PMSI secured party is limited to the good that they enabled the debtor to acquire.