What Is the Debt To Capital Ratio?
 A company’s financial leverage is measured by the debt-to-capital ratio. The debt-to-capital ratio is derived by dividing the total capital by the company’s interest-bearing debt, both short- and long-term obligations. Debt includes all interest-bearing debt. Shareholders’ equity may comprise common stock, preferred stock, and minority stakes or interests.
The debt-to-capital ratio is a liquidity metric. It compares the total liabilities of a firm to its total capital. It provides a good indication of how much of a company’s activities are supported by debt as opposed to capital. For small business owners, it offers useful insight to assess a firm’s risk profile before investing for expansion. At its core, it is a simple metric. Yet, it gives a quick thumbnail glimpse of how financially healthy your company is. Often, a company’s debt burden may appear to be excessive in raw figures. Nevertheless, the ratio may be well below acceptable risk limits when compared to the company’s overall capital.
Debt-To-Capital Ratio: Formula and Calculation
Debt-to-Capital Ratio = Debt / Debt + Shareholder Equity
- Debt includes all of a company’s short-term and long-term debt obligations.
- Shareholder equity covers all of the company’s equity, including preferred stock, common stock, and minority interest.
Calculation
The debt-to-capital ratio is calculated by dividing a company’s total debt by its total capital, which is total debt plus total shareholders’ equity. For example, consider a company with $10 million in debt and $20 million in shareholder equity. The debt-to-capital ratio is calculated like this:
$10 million/$10 million + $20 million = 0.33 or 33% debt-to-capital ratio
It is a deceptively simple metric. But, it quickly reveals that a third of a company’s operations are funded using debt, including short- and long-term loans. The debt-to-capital calculations are based on readily available information found in a company’s annual report.
Debt-To-Capital Ratio – What Does It Tell You?
Analysts and investors may use the ratio to determine a company’s financial structure and if it is a good investment. When all other factors are equal, a corporation with a greater debt-to-capital ratio is riskier. This is because the higher the debt-to-equity ratio, the more the firm is supported by debt rather than equity. It implies a higher obligation to repay the debt and a higher risk of loan forfeiture if the debt goes into default. However, while a certain level of debt may severely handicap one organization, it may have an insignificant impact on another. As a result, total capital defines debt as a percentage of capital rather than a cash figure. Therefore, it provides a more realistic view of the company’s health.
When analyzing debt-to-capital ratios, it’s important to know what a good or terrible number is. Simply put, there are no hard and fast rules. In general, a larger debt-to-capital ratio indicates that a firm is riskier. A sunned downturn puts the firm in greater danger of not meeting its debt obligations. Further, companies that rely more heavily on debt may encounter problems if sales decrease for any reason. When there is less cash flow to satisfy debt commitments, the risk of default rises. Lenders may also perceive the firm as riskier. This may limit the firm’s capacity to borrow extra cash to run operations until sales pick up again.
What is a Good Debt-to-Capital Ratio?
In general, a company’s debt-to-capital ratio should be as low as possible. So, a lower number is considered better. However, a larger debt-to-capital ratio doesn’t automatically imply that a firm is at risk of going bankrupt. Debt levels may be greater in capital-intensive industries where companies rely substantially on outside capital to fund operations. Also, there is less risk for companies with continuous and reliable revenue. For example, those that provide a service or product that is consistently in demand with few, if any substitutes. These companies can enjoy consistent sales even when economic or market circumstances deteriorate.
Consider a young start-up company. As they try to protect their client base and expand revenues they may have larger debt-to-capital ratios. In the short term, these businesses may rely on a combination of debt and equity financing to support operations. However, as they grow and stabilize, they eventually move away from heavier debt. Investing in a startup that relies on debt to support a significant portion of its operations might be risky. Particularly if the firm fails to take off as planned for any reason. When determining the debt-to-capital ratio, a number of factors must be considered. For example, the company’s age and the industry they serve. It’s also important to keep in mind that differences in accounting standards and debt-to-capital reporting might have an impact on metrics and estimates.
Example
Let’s look at an example for a mid-size construction firm.
- Total debt is every outstanding interest-bearing debt — short- and long-term — that the business holds. This includes credit card debt, outstanding lines of credit, cash flow loans, equipment loans, vehicle loans, mortgages. Basically, include any debt that requires interest payments.
- Total shareholder equity is the total value of the business that’s owned by business partners and investors. You can find these figures on small business balance sheets or corporate financial statements. If you don’t know how much equity shareholders have, you can find it by subtracting liabilities from assets. Liabilities are everything the business owes, including debts. Assets are everything the business owns. Whatever’s left represents shareholders’ equity.
The business has the following outstanding debts:
- $1,500,000 in equipment loans
- $150,000 in credit card debt
- $100,000 outstanding on a line of credit
- A $1 million mortgage on property and office space
So his total debt is $2.75 million ($1,500,000 + $150,000 + $100,000 + $1,000,000 = $2,750,000).
The total shareholder equity is $8.25 million, from contributions made by the major shareholder into the company as well as money raised from minor investors.
Using the formula, the company’s debt-to-capital ratio, expressed as a percentage, is 25%:
Debt-to-Capital Ratio = $2,750,000 ÷ ($2,750,000 + $8,250,000) = 0.25, or 25%
Assume a bank manager is considering this firm for a loan. The manager compares the example firm to another with a debt-to-capital ratio of 45%. In that scenario, the referenced company is a safer bet, all other factors being equal. This is because its financial leverage is significantly less than that of the comparable company (25% vs 45%).
Debt-to-Capital Ratio for a Mutual Fund
The debt-to-capital ratio for a fund’s underlying stock holdings is derived by dividing each security’s long-term debt by its total capitalization. Total capitalization is defined as common equity plus preferred equity plus long-term debt. It is a measure of the company’s financial leverage. Stocks with high D/C ratios are often riskier than those with low D/C ratios, all else being equal. Due to accounting rules, debt-to-capital ratios can be deceptive. Balance sheets are based on historic cost accounting. Therefore, they may bear little resemblance to current market values.
Limitations of Using Debt-To-Capital Ratio
Accounting norms may have an impact on a company’s debt-to-capital ratio. Financial statement values are frequently dependent on past cost accounting and may not reflect genuine current market values. Of course, it’s critical to ensure that the right quantities are utilized in the computation. Otherwise, the ratio can get skewed or even deliberately manipulated. The debt-to-capital ratio is a basic concept. Nevertheless, it can be a valuable tool when making investment decisions. For example, investing in firms with a greater debt-to-capital ratio might be risky. Particularly if such companies are hit by stock market volatility or a general economic slump. Using the debt-to-capital ratio in conjunction with other key financial ratios will help you receive the most accurate picture of a company’s capacity to weather storms.
Drawbacks
Although the D/C ratio is a better indicator than just adding up a company’s debt commitments, it does have drawbacks. Consider the following debt-to-capital ratio restrictions when considering whether to invest or lend:
- Limited information used alone – An analyst uses other tools to get a comprehensive sense of a company’s overall value as an investment. For example, the debt-to-asset ratio compares a company’s debt obligations to its total assets. The debt-to-equity ratio compares a company’s total liabilities to its shareholders’ equity. Other financial measures, in conjunction with the debt-to-capital ratio, provide an overview of the bigger picture.
- Debt service bias – As a measure of leverage, the debt-to-capital ratio tends to favor companies and sectors that do not heavily rely on debt. However, huge, capital-intensive businesses, such as electricity providers or other utilities, have a large, stable client base. This means they can count on a steady stream of revenue even if they have significant short- and long-term debt to service. These businesses are likely to be less vulnerable to transitory shortages or downturns due to the essential services they provide. Newer, fast-growing businesses may be vulnerable to a gradual leveling off of revenues. As a result, maturity or market changes can make increased debt payment expensive or impossible.
- Accounting standards – Actual values can vary from company to company, industry to industry, and historical periods being considered. For example, accounting standards may differ when a company’s financial statements employ out-of-date methods. For an accurate comparison, it’s critical to have the most up-to-date information. This may necessitate deeper study and analysis. (Source: masterclass.com)
Up Next: What Is a Bullish Harami?
 A bullish harami is a simple candlestick chart pattern that indicates the reversal of a bearish trend in an asset or market. A smaller body on the next candle must close higher within the body of the previous day’s candle to form a bullish harami. Technical traders believe this indicates a larger possibility of a reversal.
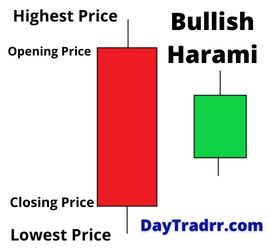
Chart-watchers believe a bullish harami is a candlestick pattern that indicates a bottom when it is preceded by a fall. It is a two-candle bullish reversal pattern. The first candle has a relatively large red body (bearish) and the second one has a smaller green body (bullish) that’s size is contained within the body of the first candle. This is also known as an inside day pattern. The upper and lower shadow lines of the second candle are short and should also fall within the body of the first candle. It’s a sign that the present downward trend (short or long term) is coming to an end, and that a positive trend reversal is on the horizon.
The illustration above depicts a bullish harami. The first red candle indicates a downward trend in the asset. Next, the subsequent green candle represents a slightly upward trend the following day. The body size of the green candle is completely contained by the body of the previous candle. Investors seeing this bullish harami may be encouraged by this pattern, as it can signal a reversal in the market.