What is the Standard Error Formula Used For?
 The standard error formula measures the deviation of a sample mean from a true population mean. In finance, it is used to measure volatility and risk.
The standard deviation (SD) is quite similar to the standard error (SE). Both measure spread and disbursement. The greater the number, the more dispersed the data is. Simply expressed, the two phrases are essentially equivalent. However, there is one significant distinction. The standard error is based on statistical sample data. On the other hand, standard deviations are based on actual parameters like population data. In statistics, words like the standard error of the mean and standard error of the median are used. The SE indicates how far the sample statistic such as the sample mean deviates from the true population mean. The smaller the SE, the larger the sample size. In other words, the larger the sample size, the closer the sample mean is to the population mean.
Standard Error Meaning
One of the mathematical tools used in statistics to measure variability is the standard error, abbreviated as SE. The standard error of a statistic or an estimate of a parameter is the standard deviation of its sampling distribution. The standard error is defined as an estimate of that standard deviation.
Standard Error Formula
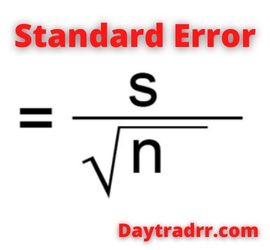
The SE formula determines the accuracy of a sample that represents a population. When the sample mean deviates from the specified population, this deviation is calculated as follows:
Standard Error = S / √n
Where:
- S is the standard deviation
- n is the number of observations.
Standard Error of the Mean (SEM)
The standard error of the mean is also known as the standard deviation of the mean. It is defined as the standard deviation of the population’s sample mean and abbreviated as SEM. Normally, the sample mean is used to estimate the population mean. However, if another sample is taken from the same population, we may get a different number. As a result, there would be a population of the sampled means, each with its own variance and mean. This is defined as the standard deviation of such sample means across all available samples drawn from the same population. The term SEM refers to a standard deviation estimate derived from a sample. It is calculated as the standard deviation divided by the sample size. It utilizes the standard error formula using different input data.
Standard Error of the Mean Formula = s / √n
Where:
- s is the standard deviation
- n is the number of observations.
SEM is computed by taking the standard deviation and dividing it by the sample size’s square root. By assessing the sample-to-sample variability of the sample means, the standard error determines the accuracy of a sample mean. The SEM describes how precise the sample mean is as an estimate of the population’s real mean. As the sample size increases, the SEM reduces versus the SD. Conversely, as the sample size increases, the sample mean more precisely represents the true mean of the population. Increasing the sample size does not always make the SD larger or smaller. It simply becomes a more accurate estimate of the population SD. As a result, if the consequence of random fluctuations is significant, the standard error of the mean will be greater. However, if no change in the data points is seen after repeated experiments, the standard error of the mean will be 0.
Standard Deviation vs SEM
The standard error formula is used to calculate the standard deviation (SD) as well as the standard error from the mean (SEM). Standard deviation and standard error are both employed in statistical studies across the board. This includes studies in finance, medicine, biology, engineering, psychology, and so on. The standard deviation (SD) and estimated standard error of the mean (SEM) are used in these studies to provide sample data characteristics and to explain statistical analysis results. Some studies, however, occasionally mix up SD with SEM. Such researchers should keep in mind that the SD and SEM computations involve various statistical conclusions, each with its own meaning.
- The standard deviation (SD) measures the amount of variability, or dispersion, between individual data values and the mean. The SD is always less than the SEM. To put it another way, SD reflects how well the mean resembles the sample data.
- The standard error of the mean (SEM) measures how far the sample mean (average) of the data is likely to be from the true population mean. It denotes the spread of individual data values. The meaning of SEM includes statistical inference based on the sampling distribution. In other words, SEM is the SD of the theoretical distribution of the sample means (the sampling distribution). The standard error of the mean indicates how the mean fluctuates when estimating the same quantity with different tests. As a result, if the consequence of random fluctuations is significant, the standard error of the mean will be greater. However, if no change in the data points is seen after repeated experiments, the standard error of the mean will be 0.
Standard Error and Standard Deviation in Finance
In finance, consider a stock or security’s mean daily return.
- The standard error (SE) assesses the accuracy of the sample mean as an estimate of the asset’s long-run (consistent) mean daily return.
- The standard deviation (SD) of the return, measures differences of individual returns from the mean.
As a result, SD is a measure of volatility that can be used to assess the risk of an investment. Assets with larger daily price changes have a higher SD than assets with smaller daily price movements. Assuming a normal distribution, approximately 68 percent of daily price changes are within one standard deviation of the mean. Approximately 95 percent of daily price changes are within two standard deviations of the mean.
Example
For example, consider Johnson & Jackson Inc stock. For the tenure of 16 years, the stock delivered a mean dollar return of $50. It was observed that the stock delivered the returns with a standard deviation of $5. An investor can calculate the overall standard error on the mean returns offered by the stock.
16 years, mean return $50, Deviation of $5
Solution:
- Standard Deviation (σ) = $5
- Number of Years (n) = 16
- Mean Dollar Return = $50
- σ͞x = σ/√n
- = $5/√16
- = $5/ 4.0
- σ͞x =$1.25
Therefore, the investment offers a dollar standard error on the mean of $1.25 to the investor when held the position in the Johnson & Jackson stock for 16 years. However, if the stock is held for a higher investment horizon, then the standard error on the dollar means would reduce.
Up Next: What Is Marxism?
 Marxism is the political, economic, and social theories of Karl Marx embracing the inevitable evolution of harmonious, classless socialism.
Marxism holds that the fight between social classes is a major force in history. Further, that there will eventually be a society without classes. It investigates the impact of capitalism on labor, productivity, and economic progress. It advocates for a worker revolution to demolish capitalism and replace it with communism or socialism. According to Marxism, there is a fight between social classes. Specifically, between the bourgeoisie or capitalists, and the proletariat, or workers. Ultimately, economic relations in a capitalist economy will eventually lead to revolutionary communism.


